Product sales statistics chart by month

Hello,
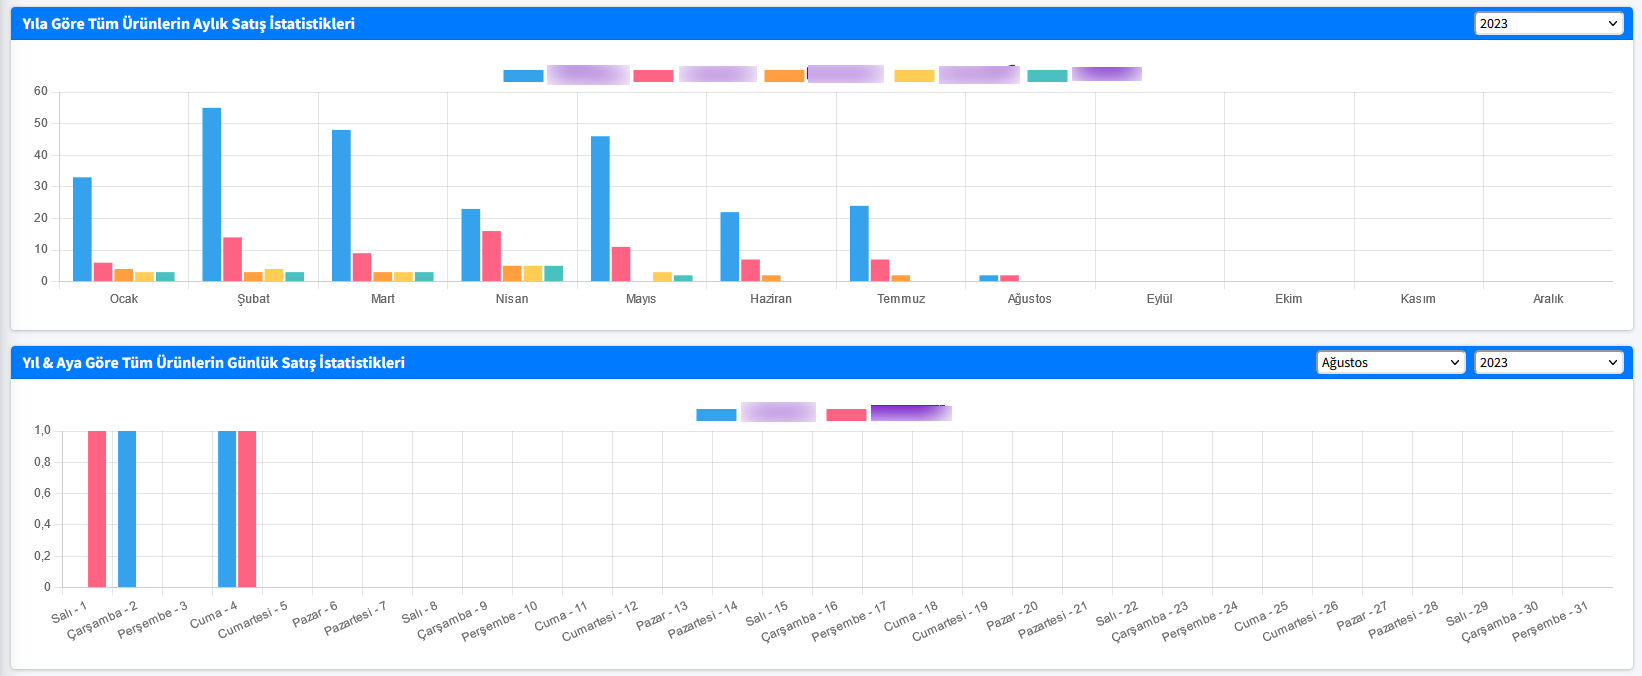
What I want to do is show multiple product charts within each month

https://jsfiddle.net/ademgenc/rym35aqx/
I tried to adapt this code I found ready for myself and I want to create this table with a query in the database.

    $sql = $db->prepare( " SELECT product, COUNT(*), MONTH(date) FROM table WHERE YEAR(date)='2022' GROUP BY product, MONTH(date) ORDER BY MONTH(date) ASC, COUNT(*) DESC " );
    $sql->execute();
    $sql->fetchAll(PDO::FETCH_GROUP|PDO::FETCH_COLUMN);

With the above query the following server is giving

Array
(
    [product_1] => Array
        (
            [0] => 17
            [1] => 33
            [2] => 14
            [3] => 36
            [4] => 26
            [5] => 17
            [6] => 18
            [7] => 24
            [8] => 23
            [9] => 51
            [10] => 30
            [11] => 23
        )

    [product_2] => Array
        (
            [0] => 10
            [1] => 20
            [2] => 11
            [3] => 7
            [4] => 6
            [5] => 9
            [6] => 3
            [7] => 2
            [8] => 10
            [9] => 8
            [10] => 6
            [11] => 8
        )

    [product_3] => Array
        (
            [0] => 5
            [1] => 4
            [2] => 4
            [3] => 6
            [4] => 1
            [5] => 2
            [6] => 2
            [7] => 6
            [8] => 4
            [9] => 2
            [10] => 2
            [11] => 3
        )

    [product_4] => Array
        (
            [0] => 2
            [1] => 3
            [2] => 2
            [3] => 3
            [4] => 2
            [5] => 3
            [6] => 1
            [7] => 2
            [8] => 2
            [9] => 4
            [10] => 4
            [11] => 3
        )

    [product_5] => Array
        (
            [0] => 1
            [1] => 3
            [2] => 3
            [3] => 2
            [4] => 6
            [5] => 4
            [6] => 1
            [7] => 2
            [8] => 1
            [9] => 4
            [10] => 4
            [11] => 3
        )

    [product_6] => Array
        (
            [0] => 1
            [1] => 3
        )

    [product_7] => Array
        (
            [0] => 2
        )

)

The last two items in the series have one sale in 1 month and the other in 2 months. I don’t know if 0 should be added to the array in non-sales months

In the example employee I manually added 0 values for the months without sales

hand made series

const data_arr = {"PRODUCT_1":[17,33,14,36,26,17,18,24,23,51,30,23],"PRODUCT_2":[10,20,11,7,6,9,3,2,10,8,6,8],"PRODUCT_3":[5,4,4,6,1,2,2,6,4,2,2,3],"PRODUCT_4":[2,3,2,3,2,3,1,2,2,4,4,3],"PRODUCT_5":[1,3,3,2,6,4,1,2,1,4,4,3],"PRODUCT_6":[0,1,0,0,0,3,0,0,0,0,0,0],"PRODUCT_7":[0,0,0,0,0,0,0,0,2,0,0,0]};

how to do for loop with javascript

Note: maximum 5-6-7 items available here

Here’s how you can loop through your data:

const data_arr = {"PRODUCT_1":[17,33,14,36,26,17,18,24,23,51,30,23],"PRODUCT_2":[10,20,11,7,6,9,3,2,10,8,6,8],"PRODUCT_3":[5,4,4,6,1,2,2,6,4,2,2,3],"PRODUCT_4":[2,3,2,3,2,3,1,2,2,4,4,3],"PRODUCT_5":[1,3,3,2,6,4,1,2,1,4,4,3],"PRODUCT_6":[0,1,0,0,0,3,0,0,0,0,0,0],"PRODUCT_7":[0,0,0,0,0,0,0,0,2,0,0,0]};

for (let product in data_arr) {
    console.log(`Sales for ${product}:`);
    
    // Loop through the sales array
    for (let month = 0; month < data_arr[product].length; month++) {
        console.log(`Month ${month + 1}: ${data_arr[product][month]} sales`);
    }
}

This will print the sales for each product by month to the console.

If you want to fill in zeroes for months that have no sales and your data might not include every month for each product, you do it like so;

const data_arr = {"PRODUCT_1":[17,33,14,36,26,17,18,24,23,51,30,23],"PRODUCT_2":[10,20,11,7,6,9,3,2,10,8,6,8],"PRODUCT_3":[5,4,4,6,1,2,2,6,4,2,2,3],"PRODUCT_4":[2,3,2,3,2,3,1,2,2,4,4,3],"PRODUCT_5":[1,3,3,2,6,4,1,2,1,4,4,3],"PRODUCT_6":[0,1,0,0,0,3,0,0,0,0,0,0],"PRODUCT_7":[0,0,0,0,0,0,0,0,2,0,0,0]};

for (let product in data_arr) {
    // Ensure that the sales array has 12 elements
    while (data_arr[product].length < 12) {
        data_arr[product].push(0);
    }

    console.log(`Sales for ${product}:`);
    
    // Loop through the sales array
    for (let month = 0; month < data_arr[product].length; month++) {
        console.log(`Month ${month + 1}: ${data_arr[product][month]} sales`);
    }
}

This will ensure that each product has a sales figure for each month, even if it is 0.
Hope this will solve what you need, good luck.

Thank you for the answer
How to apply the chart below

https://jsfiddle.net/ademgenc/rym35aqx/

var data = {
  labels: ["Ocak","Şubat","Mart","Nisan","Mayıs","Haziran","Temmuz","Ağustos","Eylül","Ekim","Kasım","Aralık"],
  datasets: [{
    label: "PRODUCT_1",
    backgroundColor: "#008000",
    data: [17,33,14,36,26,17,18,24,23,51,30,23]
  }, {
    label: "PRODUCT_2",
    backgroundColor: "#ff00ff",
    data: [10,20,11,7,6,9,3,2,10,8,6,8]
  }, {
    label: "PRODUCT_3",
    backgroundColor: "#800080",
    data: [5,4,4,6,1,2,2,6,4,2,2,3]
  }, {
    label: "PRODUCT_4",
    backgroundColor: "#ff0000",
    data: [2,3,2,3,2,3,1,2,2,4,4,3]
  }, {
    label: "PRODUCT_5",
    backgroundColor: "#800000",
    data: [1,3,3,2,6,4,1,2,1,4,4,3]
  }, {
    label: "PRODUCT_6",
    backgroundColor: "#c0c0c0",
    data: [0,1,0,0,0,3,0,0,0,0,0,0]
  }, {
    label: "PRODUCT_7",
    backgroundColor: "#00ff00",
    data: [0,0,0,0,0,0,0,0,2,0,0,0]
  }
  ]
};
    <script src="https://cdnjs.cloudflare.com/ajax/libs/Chart.js/2.9.4/Chart.min.js"></script>

and then load your data

 <canvas id="myChart" width="400" height="200"></canvas>
    <script type="text/javascript">
    var ctx = document.getElementById("myChart");

    var data = {
        labels: ["Ocak", "Şubat", "Mart", "Nisan", "Mayıs", "Haziran", "Temmuz", "Ağustos", "Eylül", "Ekim",
            "Kasım", "Aralık"
        ],
        datasets: [{
            label: "PRODUCT_1",
            backgroundColor: "#008000",
            data: [17, 33, 14, 36, 26, 17, 18, 24, 23, 51, 30, 23]
        }, {
            label: "PRODUCT_2",
            backgroundColor: "#ff00ff",
            data: [10, 20, 11, 7, 6, 9, 3, 2, 10, 8, 6, 8]
        }, {
            label: "PRODUCT_3",
            backgroundColor: "#800080",
            data: [5, 4, 4, 6, 1, 2, 2, 6, 4, 2, 2, 3]
        }, {
            label: "PRODUCT_4",
            backgroundColor: "#ff0000",
            data: [2, 3, 2, 3, 2, 3, 1, 2, 2, 4, 4, 3]
        }, {
            label: "PRODUCT_5",
            backgroundColor: "#800000",
            data: [1, 3, 3, 2, 6, 4, 1, 2, 1, 4, 4, 3]
        }, {
            label: "PRODUCT_6",
            backgroundColor: "#c0c0c0",
            data: [0, 1, 0, 0, 0, 3, 0, 0, 0, 0, 0, 0]
        }, {
            label: "PRODUCT_7",
            backgroundColor: "#00ff00",
            data: [0, 0, 0, 0, 0, 0, 0, 0, 2, 0, 0, 0]
        }]
    };

    var myBarChart = new Chart(ctx, {
        type: 'bar',
        data: data,
        options: {
            indexAxis: 'y',
            scales: {
                y: {
                    beginAtZero: true
                }
            }
        }
    });
    </script>

this will give you the exact like in the sample link. You can make changes as you wish. good luck

I create the chart by manually entering the data.
The problem is, how do I create a graph by looping through my array?
I have tried many times but I have not been successful.

I didn’t know if I needed to create the following code with the loop for each product, I couldn’t do it somehow

{
    label: "PRODUCT_3",
    backgroundColor: "#800080",
    data: [5,4,4,6,1,2,2,6,4,2,2,3]
  }

Okay, you mean that you want to create the graph as the code I provided before but this time loading the data from maybe the database instead of adding the data manually. if that’s the case, provide a sample of your data structure, as you’re saving the data into the database, then I will help you construct the var data logic so that now every aspect is attained and added automatically to the graph.

I think that’s what you want, wright

Yes,
I am pulling array from database with php and with json_encode() I get the following array.
I want to create a chart using this array.
Since I can’t loop with javascript, I did it using php foreach in javascript for now

const data_arr = {"PRODUCT_1":[17,33,14,36,26,17,18,24,23,51,30,23],"PRODUCT_2":[10,20,11,7,6,9,3,2,10,8,6,8],"PRODUCT_3":[5,4,4,6,1,2,2,6,4,2,2,3],"PRODUCT_4":[2,3,2,3,2,3,1,2,2,4,4,3],"PRODUCT_5":[1,3,3,2,6,4,1,2,1,4,4,3],"PRODUCT_6":[0,1,0,0,0,3,0,0,0,0,0,0],"PRODUCT_7":[0,0,0,0,0,0,0,0,2,0,0,0]};

The graph here I made by hand I want to do it with array
https://jsfiddle.net/ademgenc/rym35aqx/

let’s say

<?php
    $db_data_arr = [
        "PRODUCT_1" => [17, 33, 14, 36, 26, 17, 18, 24, 23, 51, 30, 23],
        "PRODUCT_2" => [10, 20, 11, 7, 6, 9, 3, 2, 10, 8, 6, 8],
        // ... your data
    ];
?>

this is how you get your data from the DB using PHP,

now let us update the code:

<script type="text/javascript">
    var ctx = document.getElementById("myChart");

    var data_arr = <?php echo json_encode($db_data_arr); ?>;

    var data = {
        labels: ["Ocak", "Şubat", "Mart", "Nisan", "Mayıs", "Haziran", "Temmuz", "Ağustos", "Eylül", "Ekim", "Kasım", "Aralık"],
        datasets: []
    };

    var colors = ["#008000", "#ff00ff", "#800080", "#ff0000", "#800000", "#c0c0c0", "#00ff00"];

    var i = 0;
    for (var key in data_arr) {
        if (data_arr.hasOwnProperty(key)) {
            data.datasets.push({
                label: key,
                backgroundColor: colors[i++],
                data: data_arr[key]
            });
        }
    }

    var myBarChart = new Chart(ctx, {
        type: 'bar',
        data: data,
        options: {
            indexAxis: 'y',
            scales: {
                y: {
                    beginAtZero: true
                }
            }
        }
    });
    </script>

I think that will work, or you can update the var data_arr with this

var data_arr = {
        "PRODUCT_1": [17, 33, 14, 36, 26, 17, 18, 24, 23, 51, 30, 23],
        "PRODUCT_2": [10, 20, 11, 7, 6, 9, 3, 2, 10, 8, 6, 8],
        "PRODUCT_3": [5, 4, 4, 6, 1, 2, 2, 6, 4, 2, 2, 3],
        "PRODUCT_4": [2, 3, 2, 3, 2, 3, 1, 2, 2, 4, 4, 3],
        "PRODUCT_5": [1, 3, 3, 2, 6, 4, 1, 2, 1, 4, 4, 3],
        "PRODUCT_6": [0, 1, 0, 0, 0, 3, 0, 0, 0, 0, 0, 0],
        "PRODUCT_7": [0, 0, 0, 0, 0, 0, 0, 0, 2, 0, 0, 0]
    };

Both ways you will get the same results. Good luck

1 Like

@katsry Thank you very much it worked perfectly

I changed the y’s to x. i want vertical chart

While creating a series with php with the help of @phdr , we added the month numbers to the key field to add 0 zeros in the months without sales.
Our array is created as follows

"PRODUCT_1":{"1":3,"2":4,"3":3,"4":5,"5":3,"6":0,"7":0,"8":0,"9":0,"10":0,"11":0,"12":0}

I found a solution to the data field in the loop as follows, but I don’t know how accurate it is

data: Object.keys(data_arr[key]).map(function(k){ return data_arr[key][k] }) //data_arr[key]

I tried to make two statistics as Daily and Monthly

Thank you very much again

@Adem am glad it worked as you expected
Good day

1 Like
Sponsor our Newsletter | Privacy Policy | Terms of Service